 +86 13600513715


News


0102030405
Technical Calculation for Bar Screens
2025-06-12
Technical Calcculation for Bar Screens
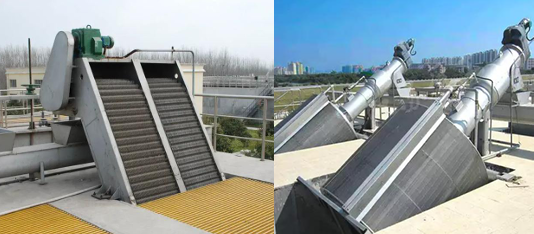
The design calculations for bar screens primarily include selection of screen type, dimensioning, hydraulic calculations, and screenings quantity estimation. Figure 2-5 illustrates a schematic diagram for bar screen calculations.
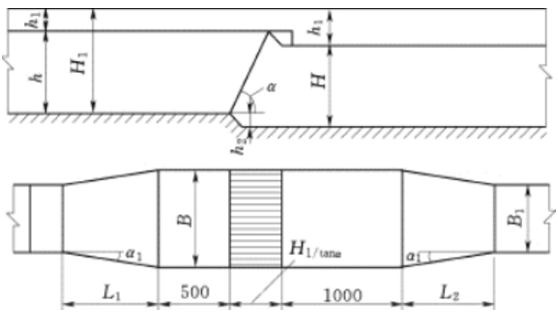
Figure 2-5 Schematic Diagram of Bar Screen Calculation
1. Screen Channel Width (B)
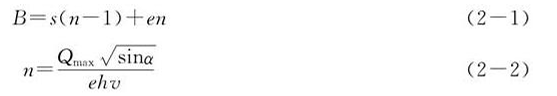
Where:
B ——Channel width (m)
s ——Bar width (m)
e ——Clear spacing between bars:
- Coarse screen: e = 50-100mm
- Medium screen: e = 10-40mm
- Fine screen: e = 3-10mm
n ——Number of bar gaps
Qmax —— Maximum design flow rate (m³/s)
α ——Screen inclination angle (°)
h ——Upstream water depth (m)
v ——Flow velocity through screen:
- 0.6-1.0 m/s (at maximum design flow)
- 0.3 m/s (at average design flow)
√sinα —— Empirical coefficient
2. Head Loss Across the Screen (h₂ )
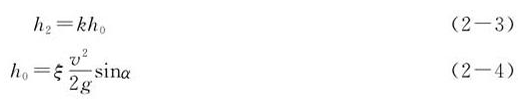
Where:
h₂ ——Head loss across screen (m)
h₀ ——Theoretical head loss (m)
g ——Gravitational acceleration (9.81 m/s²)
k —— Clogging coefficient (typically k=3, accounts for increased head loss due to debris accumulation)
ξ —— Resistance coefficient (dependent on bar cross-section shape):
- Calculated as: ξ = β(s/e)
- For rectangular bars: β = 2
To prevent upstream water backflow (surge), the channel floor downstream of the screen is lowered by h₁ as hydraulic compensation (see Figure 2-5).
3. Total Channel Height (H)

Where: H ——Total channel height (m)
h ——Upstream water depth (m)
h₁ ——Freeboard in upstream channel (typically 0.3m)
h₂ —— Head loss across screen (determined by Equation 2-3)
4. Total Channel Length (L)
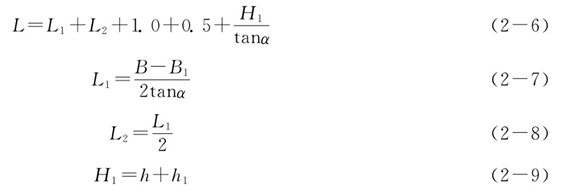
Where:
L ——Total length of screen channel (m)
H₁ ——Upstream channel height (m)
L₁ ——Length of inlet transition (widening section) (m)
B₁ ——Inlet channel width (m)
α ——Inlet transition angle (typically 20°)
L₂ ——Length of outlet transition (narrowing section) (m)
5. Daily Screenings Quantity (W)
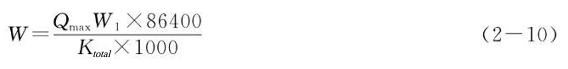
Where:
W——Daily screenings volume (m³/day)
W₁ ——Screenings yield (m³/10³m³ wastewater):
- Coarse screens: Lower range (0.01-0.03)
- Medium screens: Mid range (0.03-0.1)
- Fine screens: Higher range (0.1-0.3)
Ktotal —— Peaking factor for domestic sewage flow (refer to Table 2-1)
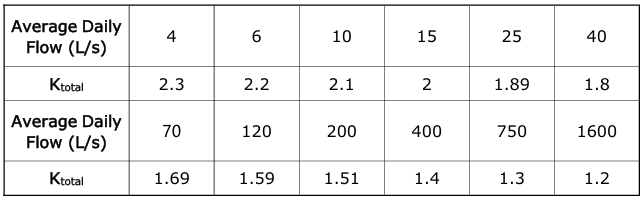
Table 2-1 Peaking Factor (Ktotal) for Domestic Sewage Flow Variation