 +86 13600513715

News


0102030405
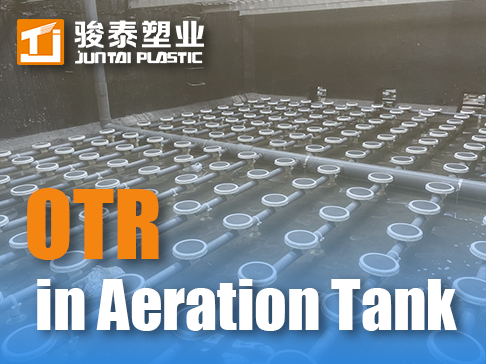
MBBR Clogging Solutions: Prevention, Control & Advanced Technologies
2025-08-13
Comprehensive Solutions to MBBR Clogging: Mechanisms, Prevention, and Advanced Control Strategies
The Hidden Crisis: How Clogging Cripples MBBR Performance
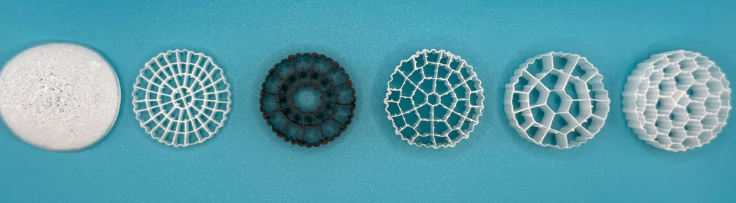
Mbbr Technology leverages suspended carriers to maximize biomass retention and treatment efficiency. However, carrier clogging remains a pervasive challenge—reducing hydraulic capacity by 30–50%, increasing energy consumption by 25%, and triggering sludge washout events. Clogging stems from three interrelated factors: physical accumulation (fibers/debris blocking screens), biofilm overgrowth (EPS-induced agglomeration), and operational imbalances (improper aeration or filling ratios). In dairy wastewater, for instance, lipid-rich streams cause carriers to cluster within 72 hours, cutting nitrification rates by 40%.
1 Core Mechanisms of Clogging: From Particles to Biofilms
1.1 Physical Clogging: Debris and Hydraulic Failures
-
Screen Blockage: Hair, textile fibers, and plastic debris (common in municipal wastewater) penetrate carrier retention screens with apertures >3mm, forming dense mats that restrict flow. These mats create backpressure exceeding 0.25 bar, forcing operators to reduce flow rates by 45%.
-
Carrier Entrapment: Dead zones with velocities <0.15 m/s cause carriers to settle and interlock. In rectangular tanks, corners account for 80% of clogs due to vortex collapse.
-
Design Flaws: Oversized filling ratios (>60%) exacerbate collisions, fracturing carrier surfaces and creating microplastic fragments that jam pumps and aerators.
1.2 Biological Clogging: The EPS Menace
Microbes secrete extracellular polymeric substances (EPS)—gelatinous matrices of polysaccharides and proteins—that bind carriers into clusters:
-
Trigger Conditions: Low dissolved oxygen (<1 mg/L) or high C/N ratios (>10:1) boost EPS production by 200–300%.
-
Consequences: Agglomerated carriers reduce effective surface area by 50%, starving biofilms of nutrients and reducing COD removal efficiency by 25%.
2 Engineering Solutions for Clog Prevention
2.1 Advanced Interception Systems
Modern retention screens integrate three anti-clog features:
-
Oscillating Bar Screens: Rotate at 2–4 RPM to shear debris; reduce screen cleaning frequency from daily to weekly.
-
Pneumatic Backflush Nozzles: Blast trapped fibers with 5-bar air pulses every 4 hours.
-
Vortex Flow Modifiers: Generate lateral currents to sweep carriers away from screens.
2.2 Biofilm Management Protocols
Table: Biofilm Control Strategies by Wastewater Type
| Wastewater | Optimal Biofilm Thickness | EPS Reduction Method | Carrier Type |
|---|---|---|---|
| Municipal | 150–250 µm | Intermittent aeration | PE carriers (500 m²/m³) |
| Food Processing | 100–150 µm | Enzymatic cleaners (lipase) | EPDM-PU hybrid |
| Pulp & Paper | 80–120 µm | Weekly H₂O₂ shock dosing | Abrasion-resistant PU |
| Pharmaceutical | 50–80 µm | Cationic polymer inhibitors | Graphene-coated PP |
2.3 Aeration and Hydraulic Optimization
-
Grid Layout: Fine-Bubble Diffusers spaced at 0.8x tank width generate uniform vertical velocity (>0.3 m/s).
-
Pulsed Aeration Cycles: 5-minute high-intensity (10 Nm³/h/m²) bursts every 2 hours disrupt EPS bonds.
-
Carrier Density Control: Maintain 30–50% filling ratio; install ultrasonic sensors to detect density spikes >450 kg/m³.
3 Industrial Case Studies: Resolving Severe Clogging
3.1 Textile Wastewater Treatment (India, 20,000 m³/day)
-
Problem: Fibers jammed screens daily, reducing throughput by 45%.
-
Solution: Installed rotating drum filters (1mm mesh) upstream + backflush-enabled retention screens.
-
Result: Screen cleanings reduced from 24/year to 2/year; carrier recovery rate >99%.
3.2 Brewery Wastewater (Belgium, 5,000 m³/day)
-
Problem: Starch-induced EPS caused massive carrier agglomeration.
-
Solution: Added amylase dosing (20 ppm) + switched to microtextured EPDM carriers.
-
Result: Clogging incidents dropped by 90%; COD removal stabilized at 95%.
4 Predictive Maintenance and Monitoring Framework
4.1 Key Performance Indicators (KPIs) for Clog Risk
| Parameter | Safe Range | High-Risk Threshold | Corrective Action |
|---|---|---|---|
| Pressure Drop (bar) | <0.15 | >0.25 | Inspect screens; reduce MLSS |
| Carrier Density (kg/m³) | 300–400 | >450 | Remove 10% carriers |
| Biofilm Thickness (µm) | 100–300 | >400 | Increase shear via aeration |
| EPS Concentration | <50 mg/L | >100 mg/L | Add EPS inhibitors |
4.2 AI-Driven Anomaly Detection
-
Sensors: Laser turbidimeters track carrier dispersion; hyperspectral cameras map biofilm thickness.
-
Algorithms: Predict clogging 72 hours in advance by correlating MLSS spikes, DO dips, and flow asymmetry.
Conclusion: Integrating Prevention into MBBR Design
MBBR clogging is not inevitable—it demands engineered solutions at every stage: pre-screening (removing debris), carrier science (optimizing surface texture), and dynamic control (adaptive aeration/biofilm management). With JUNTAI’s anti-clogging Bio-Block carriers and smart retention systems, plants achieve >95% hydraulic availability while slashing maintenance costs by 40%.