 +86 13600513715

News


0102030405
How to adjust the PH value in the MBBR aerobic tank to achieve optimal nitrification?
2025-06-05
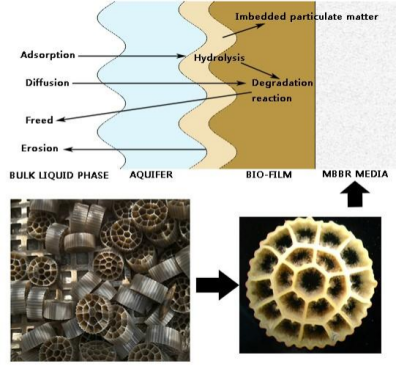
In the MBBR (Moving Bed Biofilm Reactor) aerobic tank, pH is one of the key environmental factors affecting nitrification. Nitrification is driven by autotrophic nitrifying bacteria (including ammonia-oxidizing bacteria, AOB, and nitrite-oxidizing bacteria, NOB), which are highly sensitive to changes in pH. pH influences the efficiency and stability of nitrification through multiple dimensions.
Effect of pH value on nitrification in MBBR aerobic tank
1.Fundamental Impact of pH on Nitrification
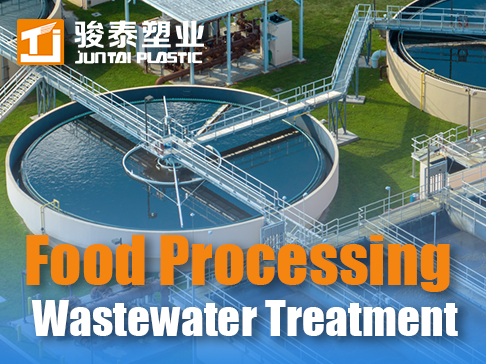
Nitrification is a biological process in wasteWater Treatment that converts ammonium (NH₄⁺) into nitrate (NO₃⁻), primarily carried out by two types of autotrophic bacteria:
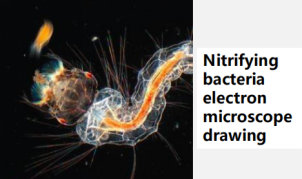
- Ammonia-oxidizing bacteria (AOB, e.g., Nitrosomonas): Oxidize ammonium (NH₄⁺) to nitrite (NO₂⁻).
- Nitrite-oxidizing bacteria (NOB, e.g., Nitrobacter): Further oxidize nitrite (NO₂⁻) to nitrate (NO₃⁻).
Changes in pH directly affect the activity of these bacteria, thereby influencing the overall efficiency of the nitrification process.
2.Effect of pH on Nitrifying Bacteria Activity
2.1 Optimal pH Range
Ammonia-oxidizing bacteria (AOB, e.g., Nitrosomonas): Optimal pH 7.5–8.5
Nitrite-oxidizing bacteria (NOB, e.g., Nitrobacter): Optimal pH 7.0–8.0
Overall best pH range for nitrification: 7.8–8.2
2.2 Effects of Low pH (<7.0)
Reduced AOB activity:
At pH <7.0, ammonia oxidation rate decreases by >50%.
At pH <6.5, nitrification nearly stops.
NOB are more sensitive:
At pH <7.0, nitrite oxidation slows faster than ammonia oxidation, leading to NO₂⁻ accumulation.
Enzyme inhibition:
Key enzymes (AMO—ammonia monooxygenase & NXR—nitrite oxidoreductase) undergo structural changes, reducing catalytic efficiency.
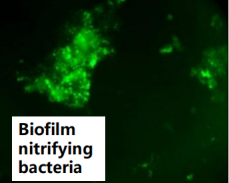
Biofilm disruption:
Reduced EPS (extracellular polymeric substances) secretion increases biofilm detachment.
2.3 Effects of High pH (>8.5)
Free ammonia (NH₃) inhibition:
At pH >8.5, NH₄⁺ converts to toxic NH₃, inhibiting nitrifiers.
Reduced NOB activity:
Nitrite oxidation slows, causing NO₂⁻ accumulation.
Biofilm instability:
Altered protein/polysaccharide ratio in EPS weakens biofilm structure
3. Mechanisms of pH Impact on Nitrification
3.1 Substrate Speciation
NH₄⁺/NH₃ equilibrium:
pH <7: NH₄⁺ dominates (non-toxic).
pH >9: NH₃ increases (toxic to nitrifiers).
NO₂⁻/HNO₂ equilibrium:
pH <6.0: HNO₂ (nitrous acid) increases, inhibiting nitrifiers.
3.2 Microbial Metabolism Effects
Impaired ATP synthesis:
Low pH disrupts proton gradients, reducing energy for nitrification.
Enzyme activity decline:
AMO & NXR efficiency drops at non-optimal pH.
Cell membrane damage:
Extreme pH disrupts membrane integrity, causing cell death
4. Causes of pH Imbalance in MBBR Systems
4.1 Causes of pH Decrease
Alkalinity consumption:
Nitrification consumes 7.14 mg CaCO₃/mg NH₄⁺-N oxidized.
Low influent alkalinity:
Soft water or RO permeate lacks buffering capacity.
Organic acid accumulation:
High COD degradation produces acids (e.g., acetate, propionate).
Insufficient denitrification:
Denitrification generates 3.57 mg CaCO₃/mg NO₃⁻-N; incomplete denitrification fails to compensate for nitrification alkalinity loss.
4.2 Causes of pH Increase
Alkaline influent:
Industrial wastewater containing NaOH, Ca(OH)₂, etc.
High ammonia load:
Incomplete nitrification leads to NH₃ accumulation.
Algal photosynthesis (open tanks):
CO₂ consumption raises pH
5. pH Control Strategies in MBBR Systems
5.1 Correcting Low pH (<7.0)
(1) External alkalinity addition:
Sodium bicarbonate (NaHCO₃):
Best option (strong buffering, no precipitation).
Dosage:
Required alkalinity (mg/L) = (Target alkalinity – Measured alkalinity) + 7.14 × ΔNH₄⁺-N
NaOH (caustic soda):
Fast pH adjustment but risks localized over-alkalinity.
Lime (Ca(OH)₂):
Low cost but causes scaling, affecting carrier fluidization.
(2) Process optimization:
Increase denitrification recycle:
Uses denitrification-generated alkalinity to offset nitrification losses.
Step-feed influent:
Directs raw wastewater (with natural alkalinity) to aerobic zones.
Reduce loading:
Lowers nitrification rate, reducing alkalinity demand.
5.2 Correcting High pH (>8.5)
(1) Acid dosing:
HCl (hydrochloric acid):
Fast-acting but requires precise control (corrosion risk).
CO₂ gas:
Most gentle method (mimics natural acidification).
H₂SO₄ (sulfuric acid):
Cost-effective but may cause sulfate buildup.
(2) Process adjustments:
Enhanced aeration:
Strips CO₂, lowering pH.
Ammonia load control:
Prevents excessive NH₃-driven pH rise.
Adjust SRT (sludge retention time):
Shortening SRT reduces nitrification exten
6. Optimal pH Control Parameters
| Parameter | Recommended Range | Control Measures |
| Best nitrification pH | 7.8–8.2 | Maintain alkalinity >100 mg/L (as CaCO₃) |
| pH <7.0 (acidic) | Emergency adjustment | Dose NaHCO₃, check denitrification |
| pH >8.5 (alkaline) | Requires reduction | Add CO₂/acid, increase aeration |

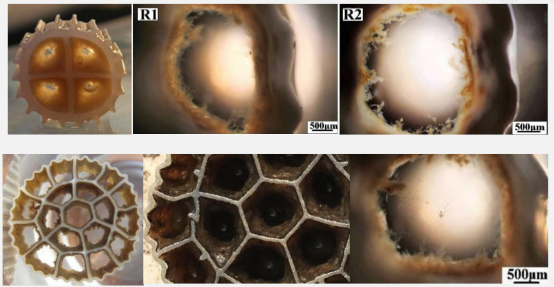
5-7 days biofilm effect

15 days biofilm effect

30 days biofilm effect
7. Conclusions
Optimal nitrification pH: 7.8–8.2 (outside this range, efficiency drops sharply).
Low pH (<7.0):Add alkalinity (NaHCO₃ preferred), optimize denitrification.
High pH (>8.5):Dose acid/CO₂, control ammonia loading.
Real-time pH monitoring (with DO, ORP) enables smart MBBR control.
Proper pH management ensures >95% nitrification efficiency and stable MBBR operation.